Posted on Thu 13 Mar 2025
Knowle West Media Centre Fellowship Summary - Part 2
Reflections on the MyWorld Community Technology Infrastructure Fellowship - Projects
Credit: David Matunda
Posted by
David Matunda
Web Developer, Digital Artist, Writer as well as a MyWorld's Fellow in residence at Knowle West Media Centre focusing on community tech and participation.Project
Fellowship in Residence: Community tech infrastructure: creative uses, community access and innovation
A 10 month practical MyWorld Fellowship aimed at exploring, testing and developing creative, accessible ways of utilising the growing KWMC community tech infrastructure.Following from Part 1, Part 2 of 3 will cover the different community technology infrastructure projects I have worked with as part of my Fellowship. Part 3 will be a summary of my reflections on the Fellowship.
Projects: Information Screen Community Feedback/Polling/Satisfaction System
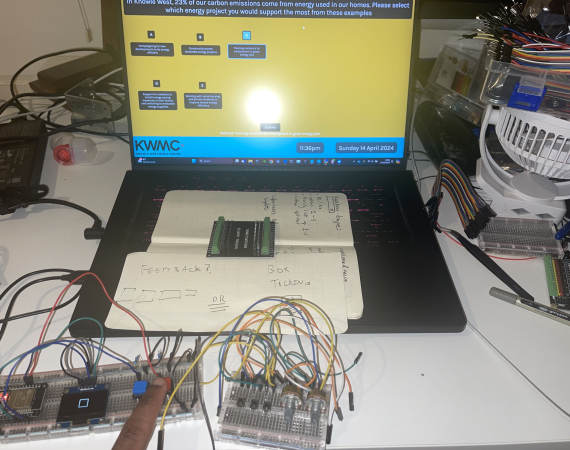
With the first project I prototyped a physical device for capturing resident responses to a questionnaire in a format similar to customer satisfaction devices but adapted to the information screen network at KWMC and its partner sites.

The questionnaire questions could be set by any team across KWMC’s partner sites in the area: The Factory (a digital fabrication space) and Filwood Community Center(a local community center). All these locations contain information screens which cycle through slides showing pictures and videos of past events as well as information about upcoming events. Non-technical staff log in to a simple front-end which allows the updating of these screens, the screens run on a raspberry pi connected to a TV in the lobby of all the sites.

The backend technology for the screens was mongoDB and an openStack cloud server with access granted from Bristol City Council. The frontend of the screens is a Vue.js JavaScript app with tailwind.css styling. Lucas, KWMC technology producer onboarded me to the VPN and development server while Dan, a freelance web developer who works with KMWC onboarded me to the frontend codebase.

I added a new category of Question to enable for questions to also be asked of residents on these screens and I worked with Chris from The Factory to prototype a slot counter tool which residents could respond to the questions within a physical and engaging way by dropping a counter corresponding to letters for the possible answers for that question. Unfortunately the slot counter prototype wasn’t going to be ready for a demonstration at the Bristol Festival of Privacy so I quickly hacked together a bluetooth controller device with buttons and dials to interact with the questionnaire and answer the questions. When a user selected a response a cumulative data visualisation artwork would be rendered on the information screen alongside the questions to add an engaging component as a substitute for the slot counters but this functionality struggled on the Raspberry Pi’s hardware running the info screen. I later iterated on this prototype device for explicit use within my art practice which I will share in my closing thoughts.

The questions asked for this questionnaire were to gather feedback after the end of the Twinergy Pilot programm. The Twinergy pilot selected a number of households in Knowle West to receive a smart device to monitor energy use and cost of energy. As well as provide cost-effective times to run energy intensive home appliances, the households were also able to sell energy back to the grid. Although the pilot ended before I started the Fellowship, I feel like I better understood the holistic vision for the benefit of an effective community technology initiative: This project began with a recognition that climate change, the cost of energy and a green energy transition are important, technology was used to involve residents in mitigating cost and monitoring energy use as well as financially benefitting participants. After the pilot stage it was important to gather feedback from all residents in the community on attitudes around the aforementioned three points: climate change, energy cost, green energy transition.

The infrastructure in this case was intended to empower teams in KWMC or any of the partner sites to specifically target members in the community who use their services for the most important kind of data. The objective for this project was to design and implement a system using the established software for the information screen carousel format that was modular and agnostic for theoretically any team to set questions and responses so that any hardware for collecting responses could be as novel and playful as it is contextually relevant to the feedback being sought as an additional aid to communicate the reason the data is being requested.

Project: 360 Cameras Knowle West Fest Portraits
MyWorld partnered with KWMC and other organisations to fund and support this Fellowship. I knew they had an extensive library of creative tech and digital production equipment that I’d want to do a prototype of something to demo and thanks to Scott from KWMC and his knowledge of all the film kit, I decided to use MyWorld’s 360 camera and combine that with some of my live video synthesis kit which is a raspberry pi and a midi with some of my live code visuals to make double portraits at the annual Knowle West Fest.
This was the only prototype on the Fellowship which didn’t directly respond to a larger community tech social concern. Knowle West Fest is a family friendly event and I liked the idea of doing something like the caricatures you sit for at the fair but instead of two people sat next to each other being drawn on paper, it’s two people sat across from each other facing a 360 camera and I’m using my laptop and a midi device.

Project: LoRaWAN Soil Moisture Monitors X SoundWave Soil Batteries
The final prototype I made on the Fellowship was a soil moisture sensor placed in soil which was simultaneously powering a soil battery and communicating the sensor data through KWMC’s LoRaWAN network. I was helped by Simone Einfalt and Annali Grimes, both producers from KWMC. Annali was especially helpful in explaining to me the importance of understanding and being aware of the wider social motivation for KWMC in gathering, presenting and using citizen and environmental data.

The idea to make a soil battery in this project came from coming to a workshop run by DIY-Tech artist Paul Granjon where he demonstrated how to make a mud cell and explain how it all works. Paul previously worked with KWMC on the Garden Lab community tech project.

I was also inspired by the interdisciplinary approach of KWMC’s Slow the Smoke project which looked at environmental data. Slow the Smoke collaborated with citizen scientists that created air quality monitors to collect air quality data which was then turned into sound by data visualisation artist Miriam Quick of Loud Numbers and then produced into a track featuring Bristol artist T.Relly.


LoRaWAN stands for Long Range Wide Area Network. LoRaWAN is useful for sending data from low power devices like readings from environmental sensors or other Internet of Things(IOT) devices. As part of its community tech infrastructure, you can connect IOT devices like a soil moisture sensor as I did to KWMC’s LoRaWAN gateway and send its data to a database or anywhere you like by registering that device on The Things Network, Lucas onboarded me to the network so I can login and register devices. Then I followed a guide for setting up the soil moisture sensor specifically but I had to adapt it for use in Europe instead of America.

I established that the range for this sensor is somewhere halfway between KWMC and The Factory. As long as the device was powered and in this range it would be able to connect to the network and send data anywhere I specified. The soil moisture data was sent using LoRaWAN to the ThingSpeak IOT live data analytics and visualisation platform.


Unfortunately this soil data prototype was the final stage I reached in the Fellowship but my plan was to use the data from the readings as values for a performance piece in collaboration with KWMC’s Young People Program, specifically the Sound Wave team who meet with young people from the area once a week.

This would have been the final creative output combining environmental data and algorithmically generated audio and visuals to tell the story of the bioelectrogenesis process of how the soil battery is producing electricity.

The LoRaWAN sensor in the same soil sample was powered separately using three AAA batteries. It would have been interesting to also test out how effective the mud batteries could power other electronics components and explore the possibilities of live code performance using real time data from the soil. I’d envisioned a library of projects using citizen and environmental data as a way to make the data tangible and to help foster conversations around data and its implications in a community tech context more accessible.
KWMC Team! + Projects Continued:
Ella Chedburn from the arts projects team at KWMC helped me a lot with the very first project which was mapping the tech kit at the media center. It was then my job to imaginatively think of all the different community technology applications for the kit and to share this with the group.

While he was still at KWMC I reported to Lucas. He encouraged me to be ambitious and imaginative with my ideas regarding the possibilities of the technology already at KWMC. This included the kwmc.cloud platform, high-speed fibreoptic connectivity, the R&D network and the Open Programmable City Region project.
Martha, KWMC’s creative co-Director was also similarly supportive and encouraging which was very helpful. Reflecting on the Fellowship and following my conversation with Beckie, it is very clear that KWMC was always engaging in the practice of community tech infrastructuring.