
Measuring Watershed's workplace emissions
For this past year, we’ve been continuing to account for our carbon impact using our own bespoke carbon accounting tool.
This accounting enables us to more deeply understand our emissions and gather valuable insight into areas of focus for the years ahead.
Carbon footprint 2023 - 2024
Great news!
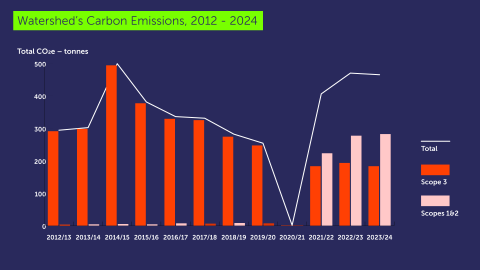
Our carbon footprint is down by 1% compared to last year. It might seem like a small dip, but given our growing ambition in carbon accounting and the ongoing recovery post pandemic, we fully expected an increase. So, we’re taking this win!
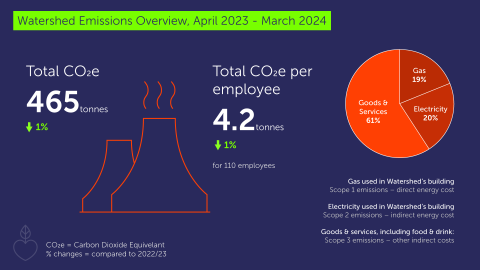
For 2023 - 2024, emissions calculated for Watershed operations are estimated to be 465 tCO2e. This is equivalent to about 257 return flights from London to New York or about 4.2 tCO2e per full time employee equivalent.
Why have our carbon emissions gone down?
This year’s overall reduction likely came from a warmer winter and fewer people working from home. But alongside that was a very slight increase in food & drink, as a result of more people visiting Watershed.
Help us make our website work better for you
We use Google Analytics to gather information on how our website is used. This helps us to make changes to our website that improve the usefulness and overall experience for our visitors.
Top ten carbon emitters 2023 - 2024
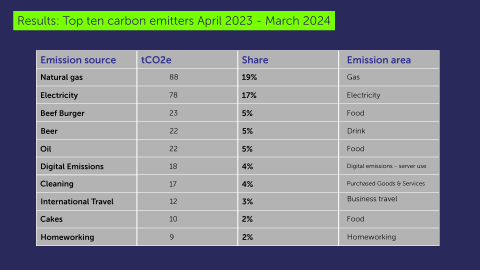
These top 10 sources make up 71% of emissions and, similar to the last few years and like many similar organisations, our biggest emissions areas are heating and energy for the building, and emissions from our food and drink supply chains.
When added together, overall Gas and Electricity make up 36% of carbon emissions and Food & Drink account for 41% of all emissions.
What next for our carbon emissions
We’ve already tackled some of the less complex steps in our climate action – such as using as many local suppliers as possible – but now we're focusing on more complex, long-term goals.
This includes retrofitting our building and addressing emissions from our food and drink supply chains. These changes will take time, collaboration, and resource but we’re confident they’ll have a positive impact in the longer term.
We may not see the fruit of this labour for a few years, but we are dedicated to it.
Feedback
We welcome your feedback, ideas and challenges.