

Layla Barron Head of Data & Systems Development
on Tue 7 Dec 2021Collecting Inclusion Data: Watershed's Approach to Balance and Belonging
Posted on Tue 7 Dec 2021
Layla Barron, Watershed's Head of Data and Operations talks about the move from diversity and demographics to balanced teams.
In this accompanying blog, Jazlyn Pinkney, former Inclusion Producer, talks about our journey that led to developing the principles at the heart of our approach to data-led inclusion.
One of those principles was holding intersectionality at the centre – in one of the meetings of our Inclusion Data Working Group, to demonstrate how an intersectional approach could align with looking at staff surveys, Jaz showed us a YouTube clip of Aubrey Blanche, then Global Head of Diversity & Belonging at tech firm Atlassian, and the inventor of the ‘Balanced Teams’ approach to building proportional representation and a culture of belonging in the workplace;
‘We've realised that in order to continue making progress, we've got to go beyond our sometimes-limited associations with “diversity.” It's not only about how many people of a specific demographic are represented at the company level. It's about balancing various perspectives--which we know come from our identities and life experiences--across teams, at all levels of the organisation. And it’s about how people feel when they come to work
Balance allows us to consider the experiences of people who are often left out of the “diversity” conversation: people with disabilities, Indigenous people, caregivers, autistic people, those with intersectional or liminal identities, and many others. We believe that helps everyone feel like they have a stake in the conversation and helps create greater incentives for everyone to support each of their teammates.’
It was a lightbulb moment for us. The concept of ‘balanced teams’ felt so right for what we were trying to achieve – so, we reframed our approach to talking about, collecting and using demographic data with balance underpinning the approach.
We made a conscious shift away from the term ‘diversity’ to ‘Balance.’ As Aubrey Blanche alludes to in her quote, diversity is often a term that is misused.
Framing the data within ‘Balance’ also helped us clarify our aims better – we’re trying to build balanced teams; teams that have a balance of different backgrounds, identities, skills and approaches to thinking.
In addition, ‘Balance’ acknowledges the aspiration of equality of representation within teams, and the organisation. When we think about ‘diversity targets’, a frequently-used approach is to set your aims in line with population statistics. We felt by doing this it not only separated the aim of the building of belonging in teams, but it also elicited a sense of false achievement - ‘once we reach X%, then we have achieved our goal’. When in fact – it’s the make-up, and presence of real Balance in a team that will foster a sense of equity and belonging. However, balance was only part of the story.
Balance is meaningless without Belonging
We felt confident in collecting our balance data – we had already been collecting annual demographic data for funders for years. We knew we needed a few tweaks to the structure to be able to breakdown the data for teams, and for management levels – and we knew we wanted to update some of the language and to analyse the data in an intersectional way. But we also knew the balance data was only half the picture – it only told us who was there. It didn’t give us insight into how people felt and whether or not they had a sense of belonging. We knew that understanding the different identities within the organisation, and developing balanced teams was just one step – it's also about ensuring we have an inclusive culture which is key to supporting people to do their best work and ultimately, making them want to stay and develop within the organisation.
“Representation has its limits. We’ve seen time and again how representation can be perceived and treated as the ultimate goal, when in reality, it is just one of many milestones toward change mistakenly dressed as completion.”
@mjmichellekim The Wake Up
After some more research, we discovered an employee engagement tech company called Culture Amp, who serendipitously had recently employed their new Senior Director of Equitable Design, Product & People – Aubrey Blanche (yes, we are now official AB fans)! Culture Amp had developed a free Diversity and Inclusion survey template which gathered feedback on seven evidence-based and research-driven constructs of diversity and inclusion that include:
- Belonging
- Fairness
- Opportunities and resource
- Decision making
- Diversity
- Voice
- Contribution to a broader purpose
Each question was a statement for the respondent to rate using a Likert scale (strongly agree to strongly disagree), accompanied by a free text box for them to add any accompanying comments.
By utilising Culture Amp’s framework and questions, and by analysing the data in tandem with the balance data, we could start to gain insight into how different groups of employees experience our organisational culture – we had found our framework for measuring Belonging.
People First, Numbers Second
As a group made up of inclusion producers (with a passion for data), and a Head of Data (with a passion for inclusion) – we were pretty excited!
But we all knew the key to this process was grounded in the engagement with the staff – without their input we would have no data, and no insight. Key to this was ensuring we could demonstrate how this data would make a difference to them. That this wasn’t just about stats, but about helping us to make meaningful change.
Communication with staff, and getting buy in was pivotal to the process.
In one of our whole organisation meetings, we ran a session ahead of the survey being published where we spoke about:
- The changes to the survey and the introduction of the belonging questions
- The group’s research: why those changes had been made, and exactly how we anticipated they would be used to inform our planning
- Acknowledged that we understood that sharing personal information in surveys is asking a lot of people, and for some people the process of putting your identity on a form requires energy and feels uncomfortable – and that we had worked to try and minimise this as much as possible by making the language in the survey, and the process, as inclusive as possible
- Talked about the emphasis on anonymity and handing the data sensitively and securely, highlighting the steps we were taking in this area so they could trust the process and hopefully feel comfortable to be open and honest as possible.
- We tried to reach people on an individual level, by emphasising this was their chance to input directly and anonymously into the process of developing our inclusion plans
- We highlighted that choosing ‘Prefer not to say’ was equally of value to the process. And that there would be space in the survey to feedback on why people chose ‘Prefer not to say’, and what we could do to potentially change that going forward.
- We also made it clear this wouldn’t be perfect, and this was the start of a process – and there would be space for people to feedback about the survey and process itself within the survey as well.
The slides and recording of this presentation were circulated to staff who weren’t able to attend, or who wanted to read through them in their own time.
The survey went out, we held our breath and safe to say – the effort and time that went into ensuring we had open and transparent communication with staff paid off, in the end we achieved a 97% response rate. Our highest ever.
A LOT of data
Even though Culture Amp’s platform provided a full system to conduct the survey, and provided the analysis – as we wanted to include additional questions (and change the language in some cases to align with our funder requirements) we decided to use our usual survey platform (Surveymonkey) and conduct the analysis ourselves.
We sought to replicate Culture Amp’s analytical framework, which was no mean feat. A pretty massive spreadsheet and about 300 graphs later we had our full breakdown:
Quantitative Data:
Singular Identity Balance Data broken down by:
- the whole organisation
- by team
- by management level
Intersectional Identity Balance broken down by:
- the whole organisation
Belonging Data broken down by:
- the whole organisation
- by team
- by Singular Identity Balance Data
- by Intersectional Identity Balance Data
Qualitative Data:
- Accompanying comments to the belonging questions
- Responses to four open ended questions on staff’s thoughts on inclusion within the organisation
- Feedback on the process
- Feedback on why people chose ‘Prefer Not to Say’
Making Sure Insight is Actionable
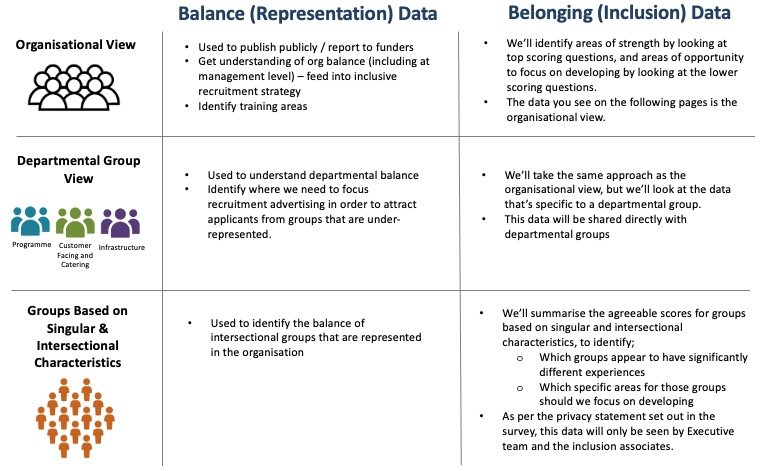
The sheer volume of data from the survey at first felt overwhelming. Culture Amp’s toolkit also helpfully provided a framework about how to use the data to prioritise and develop an action plan – we used this to help us shape our plan for how we’ll use the different breakdowns and insight the data would provide, and again we shared this with all staff;
And now the work begins…
We held another full staff meeting to share the insights from the survey, and how we were going to use those insights to inform our inclusion action plan for the next year. Read our next blog for more on how we approached this.
What we learned through the process:
“Accurately measuring the equity and experience of your organization requires identity (“diversity”) data and experiential (“inclusion”) data to understand the fairness (“equity”) of its processes. Diversity data--and how you collect it--makes an enormous difference in your ability to gain meaning from the data and make effective use of it.“ Aubrey Blanche
- Put the people you’re aiming to have an impact on at the heart of this process. Ask yourself the following:
- what are you doing to ensure their experience of engaging in a survey that asks them personal questions is as inclusive as possible?
- how are you ensuring their experience of hearing their data being reported back to them doesn’t result in any feelings of being othered or makes them hyper-visible?
- how you are going to serve them through the actionable insights from the data?
- Building trust and buy-in from staff is vital to ensuring your data is meaningful – transparency, honesty and care for the process is key.
- Don’t underestimate the amount of work and the time, you need to do this properly. Putting together the survey, pre and post survey communication with staff, and analysis and reporting writing all take significant time and resource. For us, researching language, designing the survey and preparing presentations and communications with staff took around 4 months, with the analysis, interpretation and reporting writing once the survey was conducted taking another month of dedicated work.
- Make sure you structure your survey with what you need to analyse in mind – including ensuring you will be able to satisfy all funder requirements.
- Also ensure anonymity and privacy are considered and embedded throughout – especially when sharing the data.
- Don’t rely on what you’ve always done - look to best practice from specialist organisations and thought leaders in the field for inspiration.
- Make sure you have people with the right skills working on this – ideally a group of people with skills and experience in inclusion and data analysis.
- Language evolves, accept and acknowledge that terminology especially around identity is both extremely important and developing. Look to specialist sources to keep abreast of changes in language (see appendix 1 in published report: Watershed Staff & Board Inclusion Data Report 2020/2021) and be responsive to calls for changing language whilst being aware of maintaining the ability to effectively analyse the data.
- Commit to being transparent with your findings – both with staff and publicly, even when it exposes your weaknesses. Be open and honest about where the issues are, and importantly what you’re doing to address them, and be open to being held to account.